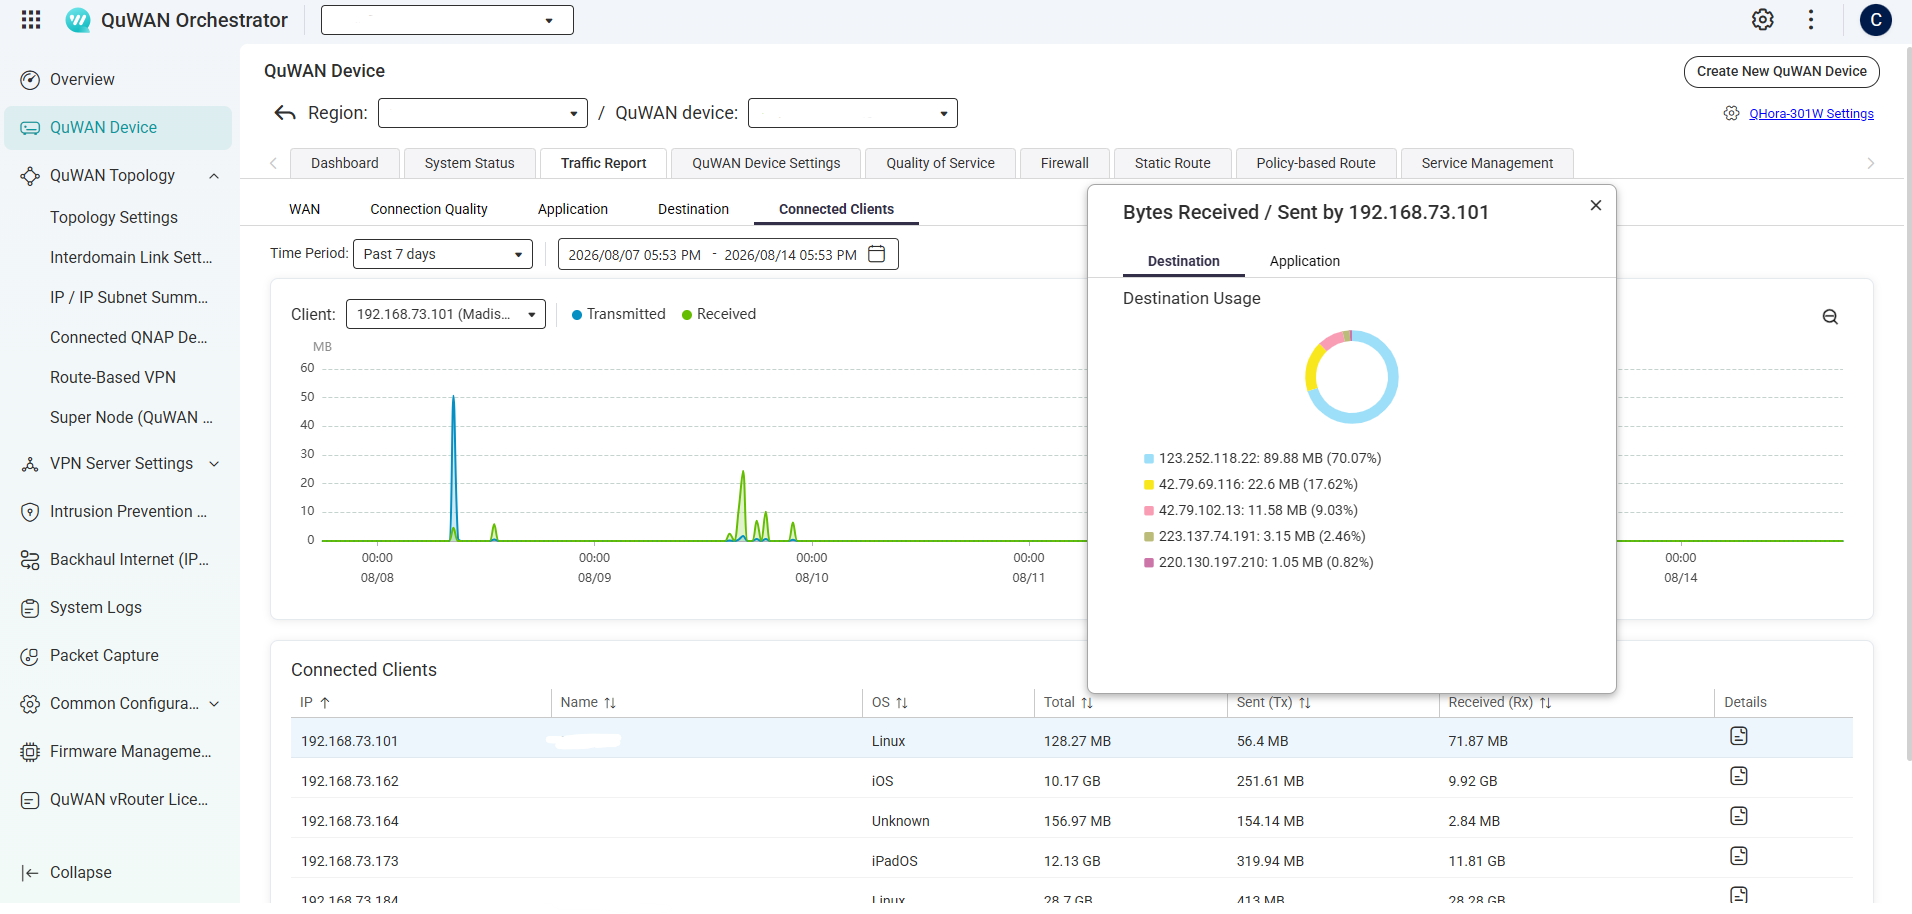
I often make use of the traffic report pages on the QuWAN Orchestrator, and would like to know if the following enhancement could be made as I believe this would be highly useful for administrators, especially when it comes to investigations for HR usage, inappropriate use or tracing the source of an attack.
At present we can see when there is traffic and on which WAN, but not source device or the destination of traffic for any given period.
Would it be possible to select a time period on a specified WAN and when selecting an area of interest (which zooms in on that area) a side panel appears showing the source hostname/IP and the destination hostname/IP of traffic and the amount of traffic for each.
An option to export that data to CSV would also be extremely useful.
Thanks so much for the detailed feedback and for taking the time to describe your use case — it’s very helpful.
Regarding source/destination visibility: you can already find this within the device details. Under a specific device, you can select a time range and view all clients under that device, along with their traffic destinations, applications used, and traffic volume. So the per-client, per-destination breakdown you’re looking for is available there today, even though it may not be surfaced directly from the WAN traffic report view you mentioned.