I recently upgraded my NAS from a QNAP TS-231P to a QNAP TS-932PX. The new setup uses 4 SSDs in RAID 6 for file sharing and 5 HDDs in RAID 6 for backups. It also runs an additional cloud backup every night.
About 10 people in our office use the NAS for file sharing, and it’s joined to Active Directory on Windows Server 2019.
Everything worked perfectly for several months. However, sometime last month users started reporting very slow performance every morning. Browsing folders or opening files can take anywhere from 2 to 30 seconds.
If I reboot the NAS in the morning, it works normally for the rest of the day. But the next morning the lag comes back, and the only way to fix it again is another reboot.
I contacted QNAP support, and their higher-level technicians tried troubleshooting but couldn’t find any clear issues. They suggested monitoring the swap file and possibly adding more RAM, but that doesn’t seem logical because:
RAM usage never goes above 40%
CPU usage stays under 10%
Network (2.5Gb) is barely utilized
I removed and rejoined the NAS to Active Directory
Ping latency between users, the server, and the NAS is always around 1 ms.
The disks are running at their proper speed.
After two weeks of troubleshooting, I’m running out of ideas. My next steps might be to remove it from Active Directory to test, or possibly reset and reformat the NAS.
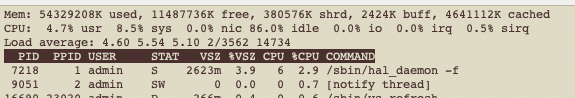
Never assume CPU usage = CPU Load. They are different. You can have a low CPU usage and a high CPU load which will absolutely affect your system. To see CPU load, open an SSH shell and run the command top. There will be a line named Load Average that consists of 3 numbers. The numbers represent the last 1 minute, 5 minute and 15 minute averages of the loading or amount of threads being processed by the CPU. If the load average number is greater than your number of cores on the unit, then you will see slow speeds. For example my TS-873A has 4 real cores each capable of 2 threads which = 8 cores. So when my TS-873A gets over 8 it begins to slow down. If you have having speed issues, check this when it is slow.
If have seen issues on my QNAP where there are zombie processes that are running that are consuming which don’t get shut down properly. I had an issue a month ago where the load was showing huge numbers. Turns out it was caused by something in Hybrid Backup Sync.
What process or application is your NAS doing say overnight or something like that which could cause the slowdown? Backups can take a lot of resources and slow things down if they did not complete before the next day. So can things with other apps, etc.
So steps to resolve this:
1.) Start by looking at TOP and seeing what your load is and if it’s high seeing if there’s an app showing high in CPU usage in the list below.
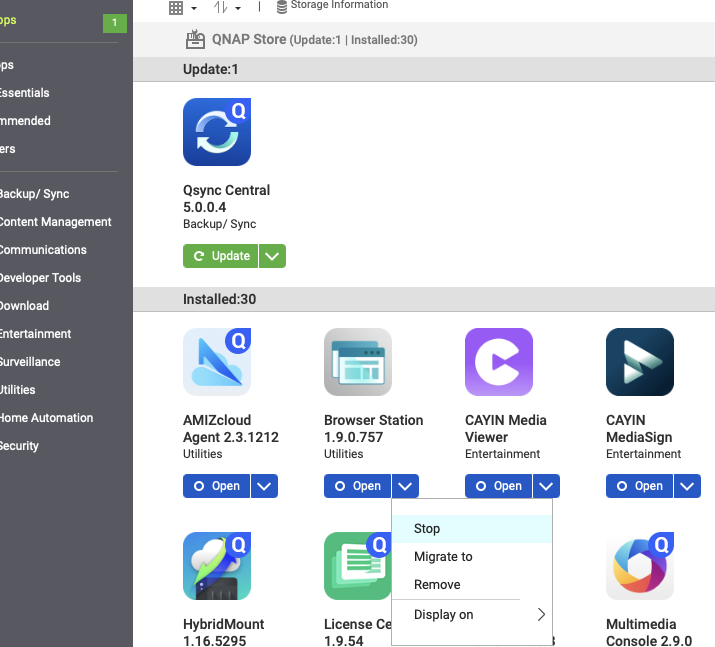
2.) Begin stopping potentially high usage apps like Container Station, Virtualization Station, etc. Stop an application from App Center. Watch for a few minutes to see if the usage starts to drop. If it does, you found the offending app. Keep doing this until you find the app sucking up your loading.
3.) With the offending app stopped, reboot the NAS.
4.) After the NAS reboots then restart the app.
5.) Monitor your loading to see if the problem still occurs.
These issues can take some time and effort to figure out. If you keep pressing QNAP support to look into this, they will help you. It will take some gymnastics with them and you will need to explain everything about what you are doing. Ask for the case to be escalated. Make sure they log into your NAS from Helpdesk and look at things.
So now, you need to figure out what is causing that. It’s hard to tell what process specifically that is. So look at the following:
1.) Are you running backups overnight?
2.) Did those backups finish before morning?
3.) What happens if you don’t run a backup overnight?
4.) Start stopping applications one by one when the load is high. Start with things like Container Station, Virtualization Station, Web Server, etc. Take them down one by one. Wait a few minutes each time and see what happens to the load. When you find the app in question, it will drop pretty quickly.
Unfortunately, your TS-932PX is an ARM A57 CPU. It’s an upgrade from your TS-231P but barely. If you are using this NAS in a business situation, you need to buy a different NAS. The ARM Cortex A57 is a great MPU but really for specific embedded applications. It’s just not what you want to use to run a file server for 10 people. I’m sorry to tell you this but you bought the wrong NAS as an upgrade. You should at the very least move to an X86 NAS and the very lowest I would go there would be an AMD Ryzen V1500B type model like the TS-x73A NAS. Better yet would be an i5 or an i7 but these start to get more pricey.
The NAS is used strictly for file sharing. It’s not hosting any servers. TS-231P worked fine for years. I upgraded to TS-932PX just to increase the disk space.
The NAS works fast whole day if rebooted in the morning. Backups are finished at night, and not running in the morning.
Your suggestion about high load average was the most helpful thing ever so far and gives me a direction for troubleshooting further.
Just a side note, if it really was just a space issue, you could have upgraded the drives in the 231P. That’s what I did (QNAP TS-231P-US 2x18TB Seagate Exos)
I usually suspect the storage devices in this type of situation. Normally, I’d suggest checking the drive stats and SMART diagnostics, but I’m not sure what’s available to you with SSDs (as I don’t have any in my own NAS units).
Maybe post the SSD model numbers and see if it triggers anything for someone else.
There is a bottleneck in there somewhere causing the CPU Load delay.
You could also enter a support ticket with QNAP and they can investigate.
The disks have been tested and running at proper speed and IOPS. I did migrate from QNAP TS-231P. So I’m thinking about resetting the whole thing starting from fresh setup.
So it is possible that there are some zombie threads left over from your backups that are not shutting down properly. I’ve seen this before.
What backup app are you using?
If you are using Hybrid Backup Sync do this:
1.) Shut down HBS
2.) Reboot the NAS
3.) Start HBS
There’s something about shutting down the app before rebooting that will kill all these leftover processes and they won’t start up again as opposed to rebooting which basically brings things back the way they were.
I disabled backup service completely and it was still slow the next morning. My latest findings is that it’s probably related to the swap file which grows to 800+MB. Nobody knows why. Tech support will connect remotely today.
I chose TS-932PX because of the amount of drives it supports. 4x 2.5” and 5x 3.5” which is very convenient. I’ve been using Synology NAS my whole life, and went with QNAP because this office already had a QNAP which made it easy to transfer the settings. I kind of regret not going with Synology.
So did you reboot the NAS after disabling your backup software?
800 MB swap should not be a problem. My swap is at 1 Gig right now and my NAS is running fine.
Have you done as I suggested and slowly shut down apps/services you are running to see what is going on?
Also, silly me for not asking this: Are you using Qsirch? Qsirch will take up an enormous amount of system resources until it indexes your entire drive.
I don’t think you are using that based on your TOP results but I have to ask. I went back and looked at the TOP results you posted. Something stands out:
First how much memory do you have?
What are you using that uses Apache? That’s the built in web server. You should not need to have it enabled unless you are running a web server app of some kind. These apps are all taking up some solid virtual memory and the %VSZ number is what is troubling. I just took a look at my rather loaded TS-873A and while my apps are all using some solid virtual memory numbers none of them are above 12% Virtual Size.
Based on your TOP output, you have used 3.71 GB of memory. You have 325 MB of memory free. This is your problem. You need more memory especially if you have 10 people sharing your NAS. Are you running with the stock 4 GB that came with the unit?
You should run at least 16 Gig if not 32 Gig IMO.
This is NOT a QNAP vs. Synology issue. This is a NAS w/o proper resources applied to it.
Suit yourself. You can ignore our suggestions, but I am telling you that 4 Gig of RAM is not sufficient. You have high virtual memory utilization because your apps are sucking up the memory you have an don’t have enough room to operate. I don’t care if your old NAS had 1 Gig and ran fine for years. It likely ran an older OS as well. My old IBM PC had 128k. It’s not enough today!
You can ignore our advice if you choose, but then there is nothing more we can do to help you.
Apache is taking up a huge amount of virtual memory resources. I don’t see this on my NAS at all. That’s why I questioned about what you are using Apache for. On my NAS, it’s so far down the list, Ican’t see it.
You also have a peer to peer agent (p2pagent) running as well that’s taking up memory resources.
You have never stated if you have attempted to shut down other apps and see what happens. That has been my suggestion from the beginning but you keep saying all you have is people sharing files, but what we are seeing is large amounts of virtual memory usage because your apps that are running are doing something, are filling up the available memory and as such, they have having to run with some of their resources cached to disk which is why it’s all so slow.
Web server is not checked. I don’t know how to disable Apache, and why is it running anyway? I though it was a part of the QNAP OS.
I don’t know how to shutdown apps that are not part of the NAS store, and no apps are installed form the NAS store except for the backup, which is currently disabled.
Nothing should be cached anywhere. We’re only using basic folder shares. Something is not right with the configuration. I’m going refresh the NAS from scratch. I have a feeling something didn’t go right with transition from the old NAS.
I think that might be a great idea as it would eliminate a number of variables.
I’m confused though by the steps that you actually took when you say you “transitioned” from your old NAS. What or how did you do for this? It may be pointless, but it may provide some insight as to what is going on. It would be unfortunate if there was an easy solution or you ended up reconfiguring something that is having an adverse effect.
If all you are using is file sharing and Hybrid Backup Sync, there may be other apps you can stop as well. Worth looking at.
OK, when I say cached, this is the OS caching your apps to disc because you don’t have enough memory. So you have all these processes running, you run out of memory so the OS then uses the hard drive space as virtual memory. It writes part or all of the apps in memory to the hard drive. Then when you want to access them, it has to read from memory, etc. This is the “swap” file.
You can try rebuilding the NAS. But I’m still thinking you are going to be running out of memory. Four gigabytes in a modern system is just not enough -especially a server…