So wondering if some of you Linux experts out there may be able to help me. I’m treading in areas where I am not really strong.
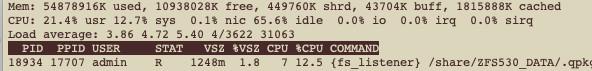
My TS-873A has been reporting excessive CPU load in TOP lately. Regularly seeing numbers in the 40s and 50s and not going down. Nothing has really changed on the system in months. It seems like I first saw this shortly after updating to h5.2.8.33559. But it’s not the firmware. I’ve downgraded it and upgraded it several times. Same thing happens.
I opened a ticket with QNAP support but all they have said so far is, "You have a lot of apps installed. Disable QSirch, disable Container Station, etc. I tried all that - no dice. Load doesn’t go down. Also, I didn’t think those would affect things as all that has been running for months with no issue.
I thought I had a handle on the issue and I was seeing normal load numbers around 5 for nearly 2 days. Then yesterday evening, it shot back up again. Funny thing was, there was nothing I was doing or running on the NAS last night.
And oddly enough, when accessing the NAS web UI, it’s not exceedingly slow like you would think when you get a load of 50. It’s slower but not unusable. Still it’s slower than it should be.
I think there’s some process that has gone awry somewhere and has likely spawned some zombie processes that are out there taking up space and resources. Problem is, I can’t find it. I have tried shutting down nearly all of the “high usage” apps and nothing affects the CPU load.
So coming on here to see if perhaps there’s some Linux clean up I need to do or cron job or something. I’m just not sure.
Thank you. Excessive CPU load for hours is abnormal. I’ve managed now to get things to settle down after the last reboot a few hours ago.
17:53:21 up 7:47, load average: 2.91, 2.88, 2.87
So this is good - what it should be!
What I really want to see is what processes are contributing to the load. Top just shows CPU percentage per the top processes which may or may not affect the loading very much.
I’ll have to look into the other utilities you mention. Maybe something there will shed some light…
And no - 4.5 is not an option. I’m running Hero anyhow…
OK, I’m going to sound like a blithering idiot here, but the apt command appears to be missing from the QNAP Linux distro. I would like to install htop.
sudo apt install htop
How does one install “normal” Linux commands like this on a QNAP?
I believe you would need to install entware or equivalent or run a container with a “real” linux distro (which actually isn’t a great idea because it means more overhead).
So looks like I have to use the Admin account for anything with Entware. I installed HTOP and it won’ run from my normal account.
How does one change that.
Also, do you know of a utility that shows the contribution of each process to the Load Average number? That’s what I really wan to see. What’s filling that up. I don’t think this really shows that either…
You must source the Entware profile first. Do this by appending the source command to .profile in your user $HOME. This file doesn’t exist by-default, so you may need to create it.
Login via SSH with your preferred user account, then run the following command:
echo '. /opt/etc/profile' >> $HOME/.profile
… then logout your SSH session, then back-in again. You should now be able to use the opkg command.
The system load average metric is a tricky thing. I’ve been using Linux for 20+ years and I’m still figuring-it-out.
I’ve never actually had my load averages increase due to hardware issues (RAM, NIC, HDD, etc…), so I’ve never had to sit-down and work-out what was going wrong.
But - in-short - it’s not entirely about CPU load. The last instance reported on the forum turned-out to be defective RAM sticks causing processes to enter wait states.
I’m hoping someone more experienced will be able to help you diagnose this, as it’s beyond my abilities.
Well, there’s actually quite a bit of customizations and information available in HTOP. Let’s see what I get as I go through this and examine what is happening…